|
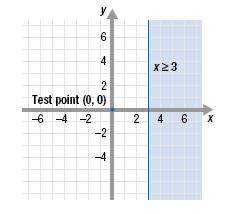
Graphing Linear InequalitiesExample 1 Graph the inequality x ≥ 3. Solution Step 1 Graph the equation that corresponds to the given inequality. Graph the equation x = 3. The graph is a vertical line through (3, 0). Since the inequality symbol “≥†contains “equal to,†draw a solid line. The solid line shows that points on the line are solutions of the inequality. Step 2 Use a test point NOT on the line to determine the region whose points satisfy the inequality. The point (0, 0) is not on the line, so it can be used as a test point. Substitute 0 for x. The resulting statement, 0 ≥ 3, is false. Therefore, the solutions do not lie in the region containing (0, 0). The solutions lie in the other region and on the line. Step 3 Shade the region whose points satisfy the inequality. Since the test point (0, 0) does NOT satisfy x ≥ 3, shade the region that does NOT include (0, 0). This is the region to the right of the solid line, including the solid line.
Note: A vertical line divides the xy-plane into three regions: • points on the line • points to the right of the line • points to the left of the line.
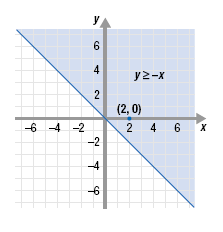
Example 2 Graph the inequality y ≥ -x. Solution Step 1 Graph the equation that corresponds to the given inequality. The equation y = -x can be written as y = -1x + 0. The y-intercept is (0, 0) and the slope is -1. We use this information to graph the equation. Since the inequality symbol “≥†contains “equal to,†draw a solid line to show that points on the line are solutions of the inequality. Step 2 Use a test point NOT on the line to determine the region whose points satisfy the inequality. The point (0, 0) is on the line, so we must select a different test point. Let’s use (2, 0). In y ≥ -x, substitute 2 for x and 0 for y. The resulting statement, 0 ≥ -2, is true. Therefore, the solutions lie in the region that contains (2, 0). Step 3 Shade the region whose points satisfy the inequality. Since the test point (2, 0) satisfies y ≥ -x, shade the region that contains (2, 0). This is the region above the solid line, including the solid line.
|
|


