|
Graphing Linear EquationsUsing the Slope-Intercept MethodObjectives 1. Determine the slope of a line from the graph. 2. Determine the slope of a line from two points on the line. 3. Determine the slope of a line from its linear equation in 2 variables. 4. Graph a linear equation in 2 variables using the slope-intercept method. The slope of a line is the ratio of the amount of rise to the amount of run,
Slope is positive if the line rises. Slope is negative if the line falls. Slope is zero if the line is horizontal. Slope is undefined if the line is vertical. Slope of a line through 2 given points: Given 2 ordered pairs, (x1, y1) and (x2, y2)
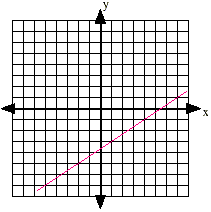
Slope intercept form of a linear equation: y = mx + b m is the slope b is the y-intercept Note that the coefficient of y must be 1!! To Graph when you know a point and the slope: 1. Plot the known point. 2. Count the rise and run from the known point. For a positive rise, count upward. For a negative rise, count downward. For a positive run, count to the right. For a negative run, count to the left. ( hint: if the slope is a whole number, make it a fraction over one) 3. Place the second point where the next ordered pair is located based on your counting above. 4. Draw a line (not a segment!) connecting the 2 points. Examples: Graph a line that contains a) the point (1, -3) with
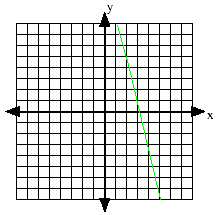
b) the point (2, 5) with m = -4
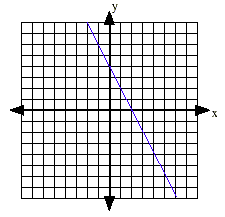
To graph a line using the slope-intercept method: 1. Put the equation in slope-intercept form (solve for y ) 2. Determine the slope and y -intercept from the equation. 3. Plot the y -intercept. 4. Locate the next point in the line by counting the slope. 5. Draw a line (not a segment) connecting the 2 points. Examples: c) y = -2 x + 4
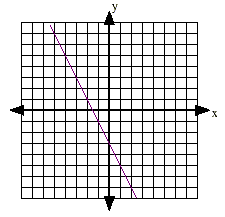
d) 6 x + 3 y = -9
e) 4y = 14
|
|


