Absolute Value Function
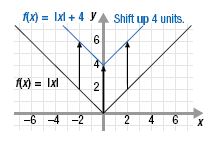
To graph an absolute value function such as f(x) = |x| + 4 we could
calculate several ordered pairs, plot them, and then connect the points.
However, the graph of f(x) = |x| + 4 is related to the graph of f(x) = |x|.
It has the same characteristic
 shape, but the
+4 outside the absolute
value symbols shifts the graph up 4 units. shape, but the
+4 outside the absolute
value symbols shifts the graph up 4 units.
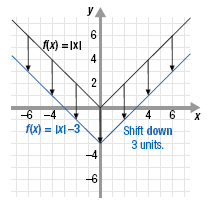
Likewise, the graph of f(x) = |x| + 3 is the same as the graph of
f(x) = |x| but shifted down 3 units.
Example
Determine the equation of Line A and Line B shown in the graph.
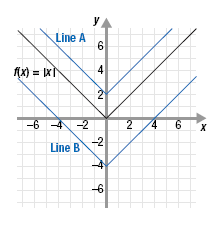
State the domain and range of each function.
Solution
Line A is the graph of f(x) = |x| shifted up 2 units. Therefore, its equation
is f(x) = |x| + 2. The domain is all real numbers; the range is y
≥ 2.
Line B is the graph of f(x) = |x| shifted down 4 units. Therefore, its
equation is f(x) = |x| - 4. The domain is all real numbers; the range is
y ≥ -4.
When a constant is added or subtracted inside the absolute value symbols
the graph of f(x) = |x| is also shifted, but this time to the left or right.
For example, the graph of f(x) = |x - 3| has the same shape as that of
f(x) = |x| but it is shifted 3 units to the right.
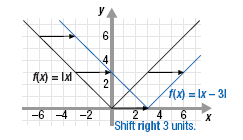
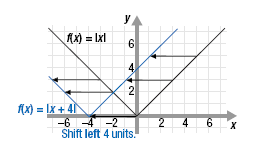
Likewise, the graph of f(x) = |x + 4| has the same shape as f(x) = |x| but it
is shifted 4 units to the left.
Be careful.
The graph of y = |x - 3| is
shifted 3 units to the right; that is, in the
positive direction along the x-axis. This
may be the opposite of what you expect. |